Nov 03 2020 0
Here are the charts on Election Day. Let's analyze them and figure out what forex trading strategy we should use.
Latest updates
- Goldman Sachs and Citibank sharply cut the EU's fourth quarter economic forecast (from positive growth to negative growth) on Monday as an increase in new Covid-19 infections led to the adoption of measures. strict blockades in many bloc countries.
- Trump at the weekend once again showed his intention to challenge any outcome that went against what he wanted, telling reporters: “As soon as that election is over, we'll get my lawyer ”.
- The pound fell to its weakest level in a month on fears that a blockade across Britain would deal a blow to the economy that was reeling from the plague.
USD/JPY chart

After creating a rounding bottom patter, USDJPY has bounced up as expected to the 105 zone. Currently, a bearish signal has also appeared on both the daily chart and the H4 chart. However, the signal is not really strong so we only go for probing short orders. It should be noted that the range for sell orders is quite wide, reaching up to 106. Hence, we need a reliable signal to enter a position with standard volume.
EUR/USD chart

The price approached the 1.16 zone as expected. You should consider hedging for the current sell orders as recommended yesterday, because it is not excluded that the price will increase correcting around this price range when the spinning top pattern has been formed on the daily chart. In case the 1.16 zone is clearly broken, consider adding new sell orders. The target will then be around the lower boundary of the bearish channel.
GBP/USD chart

Price approached the confluence area of 1,285 as expected. The bullish signal on the H4 chart also appeared together with the doji on the daily chart. You can consider buy orders. Note that this is the buyer's last stop in the short term. If it is broken, the previous bullish structure will be breached, opening the possibility of a re-test of the October bottom, around 1.27.
USD/CAD chart
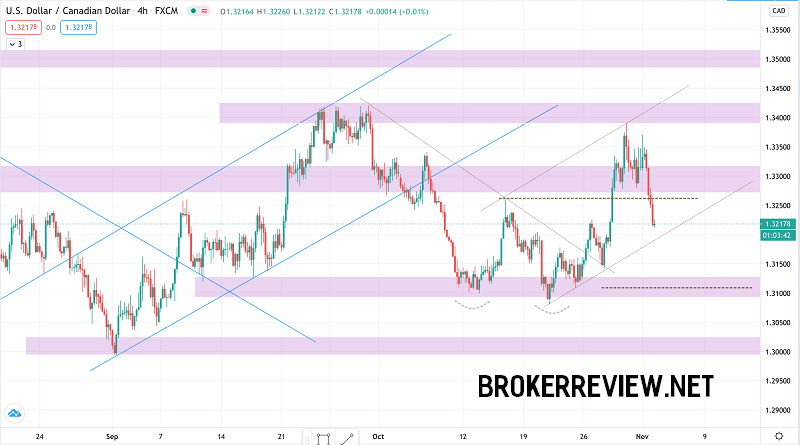
As warned about the difficulty of USDCAD's trading at the moment, after completing the double bottom pattern, the price is increasing, there was a strong and unexpected reversal at the beginning of the week. It is currently approaching the lower boundary of the newly formed up channel. However, the bearish momentum is strong, which leads to conflicting signals. Still, we do not encourage you to trade this currency pair.
AUD/USD chart

The price once again failed to penetrate the important support 0.7. However, the buying force around this price range is not too worrying. We keep the old strategy: keep the remaining short and implement risk mitigation measures. Only add new short orders when the price breaks the 0.70 zone clearly.


