Jan 15 2020 0
Let's take a look at the chart analysis for today, January 15 and see what forex strategies should we apply for each currency pair.
Latest updates:
- After much disappointing data in the first session of the week, GBP continues to suffer new losses. The main reason still comes from the increase in the ability of the Bank of England to lower the interest rate of GBP.
- The US Treasury Department on Monday said China was no longer listed as a US currency manipulation nation - a move of good faith as soon as the Chinese delegation arrived in Washington ahead of the signing of the trade agreement. One day on January 15, an event is expected to boost the world economy.
- China's export data for December, released on January 14, also showed a 7.6% increase from a year earlier. This is the first increase in Chinese exports since July 2019 and the fastest growth rate since March 2019, thereby contributing to improving market sentiment.
- The SNB's extremely lax monetary policy is facing opposition from an unusual coalition of left and right-wing politicians, and at the same time suffers from increasing criticism from entities in a strong financial sector.
EUR/USD
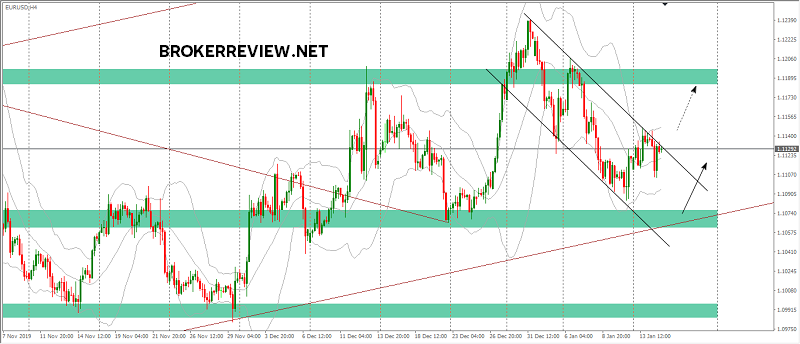
As expected, a large number of sellers returned to the confluence of 1,114, although the price recovered afterwards. This price action shows that the buyers are still strong enough and those who are long can continue to hold orders. However, new long orders are not recommended unless the price breaks out of the newly formed bearish channel or creates an uptrend signal at the lower boundary of the medium-term uptrend channel.
GBP/USD

The resistance zone of 1.295 is quite strong, so when the price is denied in this zone, it is easy to understand. However, it does not change our reduced view. In today's session, the rally can continue until the previous gap is filled and the price approaches the MA20 on the daily chart. This is also a remarkable confluence area. At that time, the selling side can come back.
USD/CAD

Not much has changed on USD/CAD. On H4, a bounce after the round bottom pattern and the accumulation area is forming, opening up the possibility of further up. However, on the daily chart, there appeared quite a force of selling and the price failed to surpass MA20. In general, if you have a short order before, you can postpone the Stop Loss to reduce the risk. If there is no command, it should only be in the observing mode at this time.
AUD/USD

AUD/USD is forming a bullish flag accumulation zone - a pattern with a relatively high probability of winning according to Thomas Bulkowski. Those who have long ago can keep the order. Those who have not yet entered the market then wait for this price pattern to formally complete and then decide.


